How Does Evolving Education Play a Part in the Election?
Background & Introduction
The election in America has been through almost a century, over such a long period, things changed dramatically. Take education for example, back in the year of 1948, there’s not much people who had a college degree and the system of education was not even comparable to today’s system. To partially prove my point of having a huge difference in education over such a long period, here is what I’ve found using the survey data.
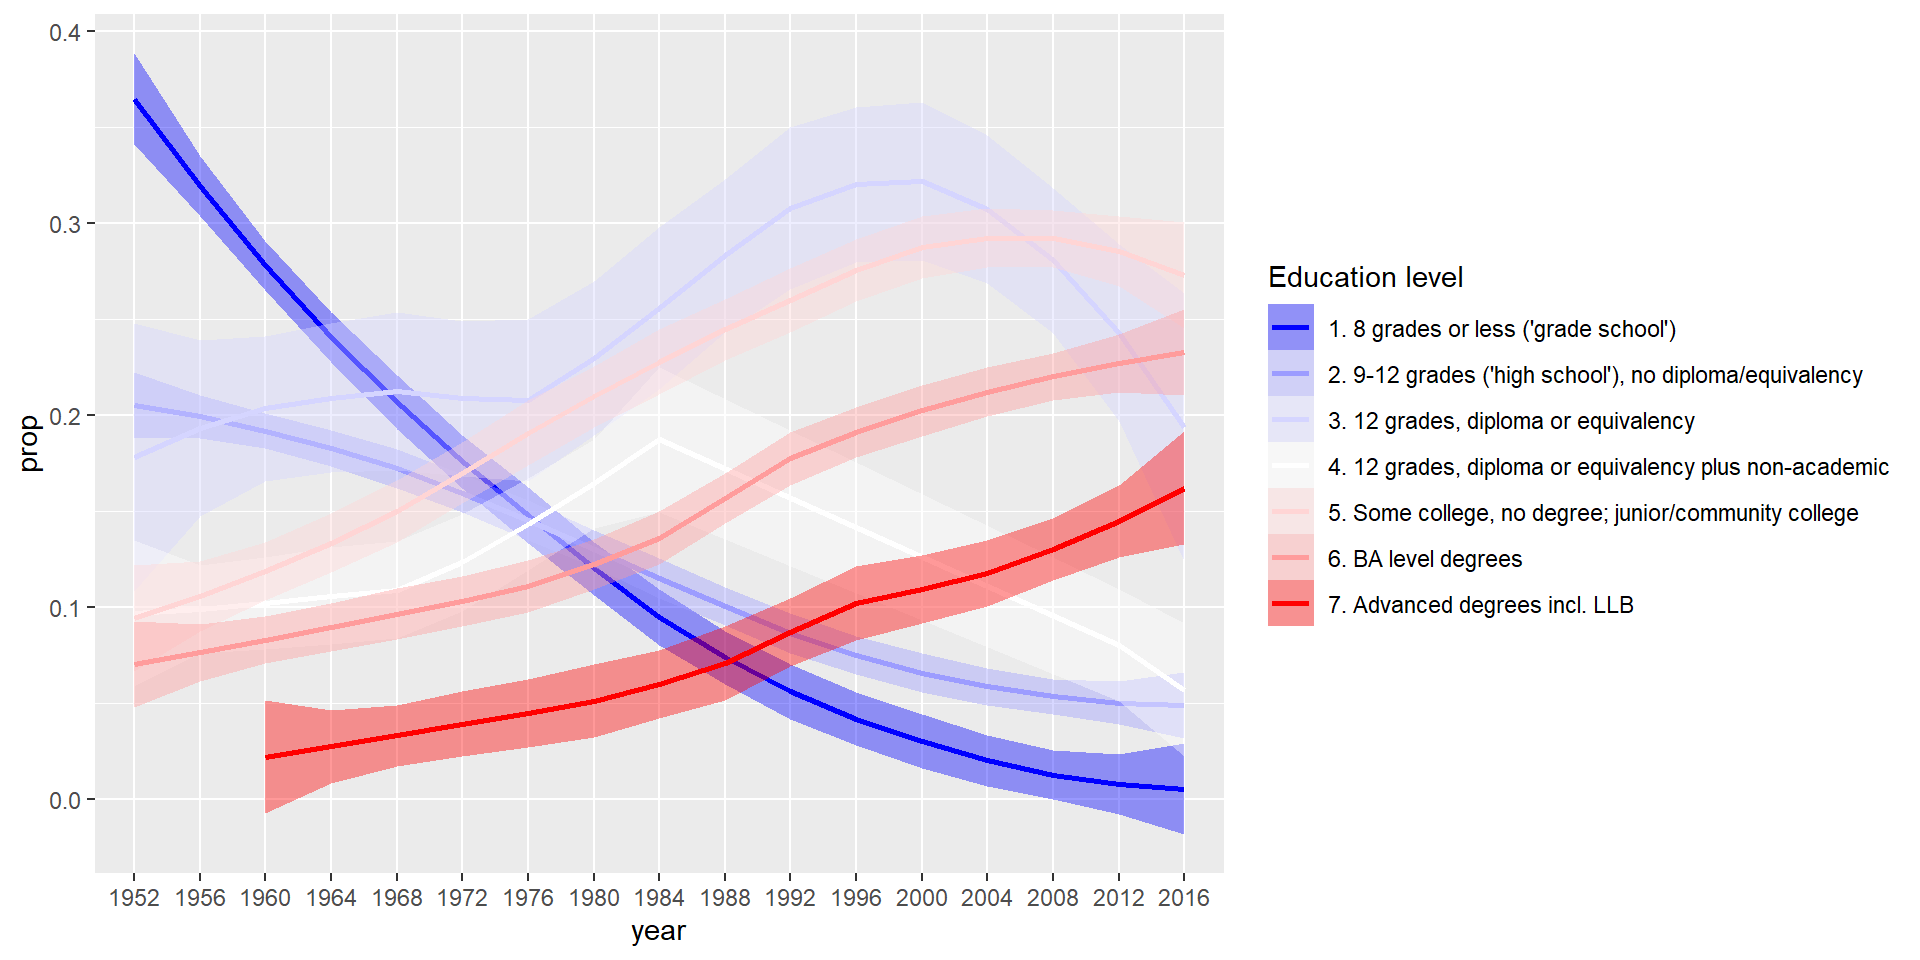
Here we can see that the Red curve increased a lot since the year 1952 whereas the blue curve went down, which at least represents that the survey’s targets are having more people with advanced degrees. Of course, the sample won’t represent the population, so the shaded area is the potential outcome within a 95% interval.
To further introduce the dataset, we are using the American National Election Studies (ANES)’s the dataset. ANES are surveys of voters in the U.S. on the national scale. For each presidential election since 1948, ANES collects responses from respondents both before and after the election. The goal of ANES is to understand political behaviors using systematic surveys. ANES’s data and results have been routinely used by news outlets, election campaigns, and political researchers.
The Time Series Cumulative Data of ANES include answers, from respondents from different years, on selected questions that have been asked in three or more ANES’ Time Series studies. A tremendous amount of effort has been put into data consolidation as variables are often named differently in different years.
This kind of change of time could influences people so much that even the voting behavior may shift from one party to the other as we are going to discuss in this analysis blog. For the purpose of discussion, we are mainly focusing on the White Americans and the two main parties in America: Democrats and Republicans. We may answer a few questions listed below to make the purpose more clear:
1. Is there a change in how White American’s high educated/low educated people vote for the party?
2. If so, what are the potential factors of such a phenomenon?
Potential Bias
Although ANES is a reliable and credible resource of data, the potential bias inevitably exists. The first is caused by the limitation of the sample size.
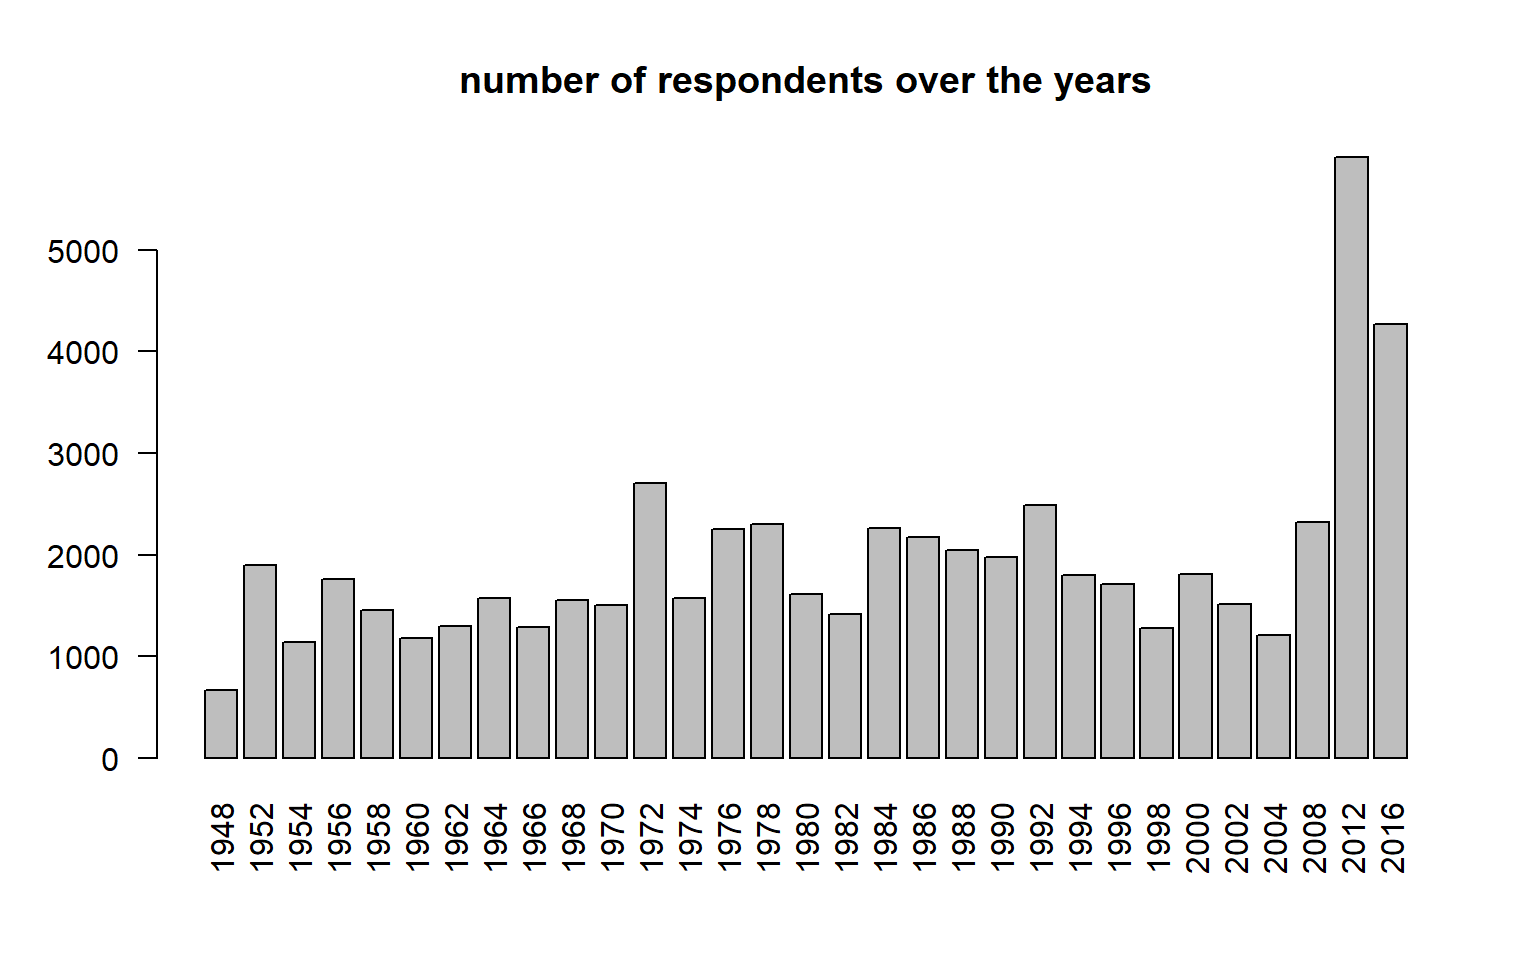 Due to some reasons with either technical or human resources issues, each voting year has a various amount of surveyed data from the lowest 662 to the highest 5914, which would cause some boost of total invested people like what happens in 2012. Therefore, we mainly use the proportion as an interest of field to discuss in this blog to eliminate the potential bias.
Another downside of the survey data is that some variables are asked nearly all the years and some are asked only a few years. This causes that each variable has at least some proportion of NA values. We can see it through the following figure by noticing how much NA values exist.
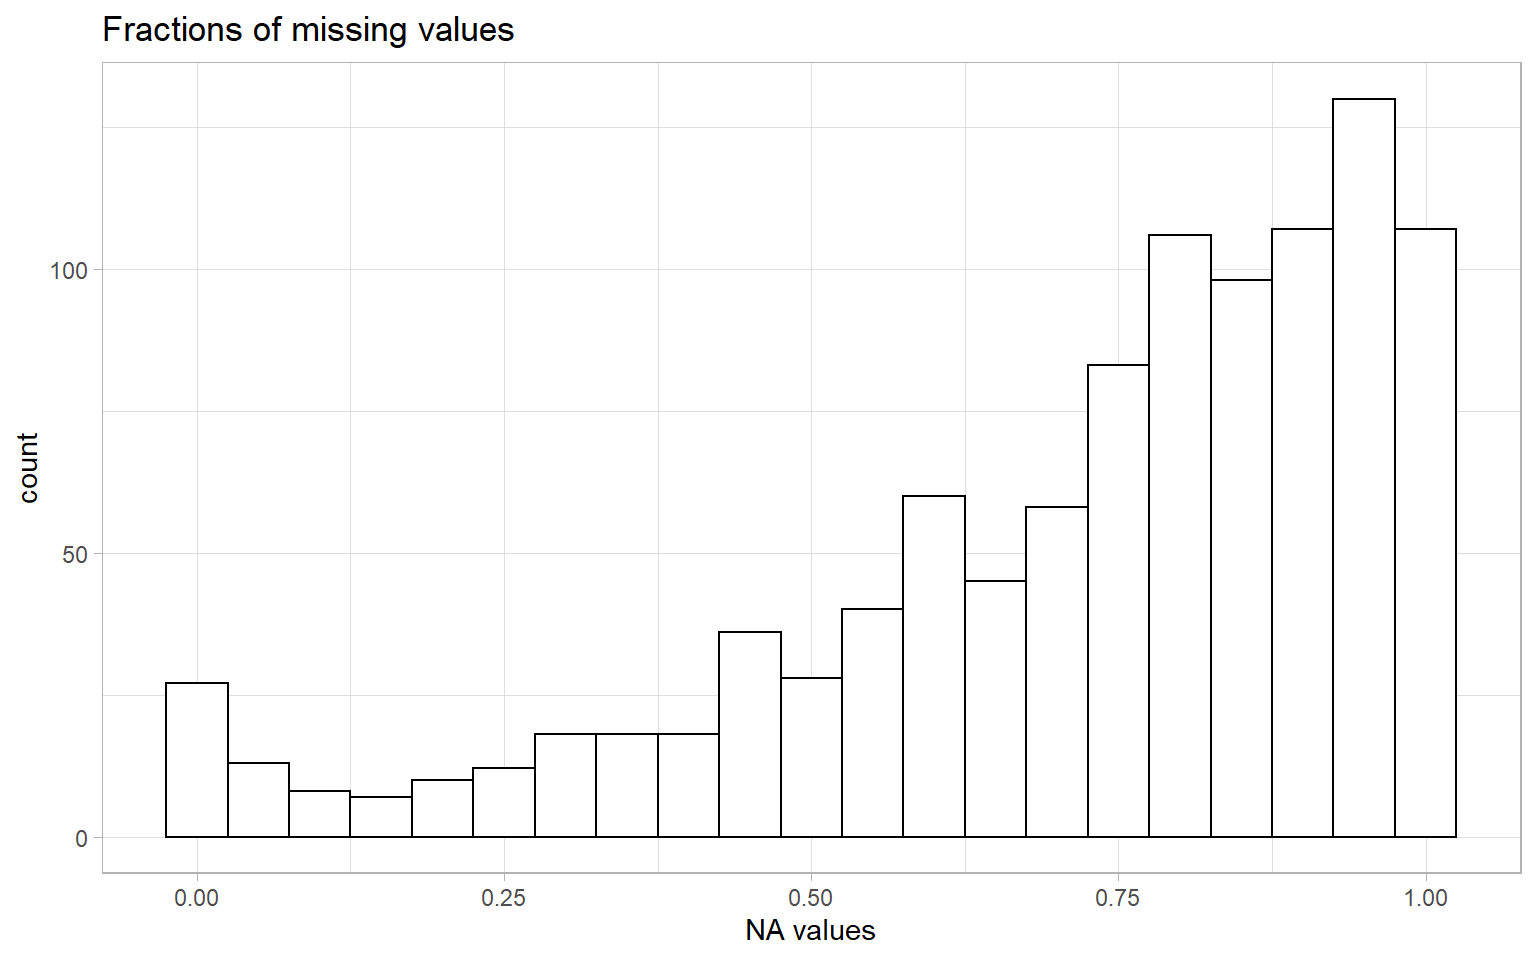
Therefore, when handling the data, we must avoid directly using the ones with NA values, or otherwise, it would be problematic for the visualization.
Before we touch on the actual data, let us think for a second, what variables could be useful when we are doing an analysis with education and the election? I’ll list all the variables that going to be discussed below, and I know there could be far more factors beyond.
- Year
- Education Level
- Race
- Turnout
- Vote
- Region
- Government Spending
- Care About Who Would Win
Education Break Down
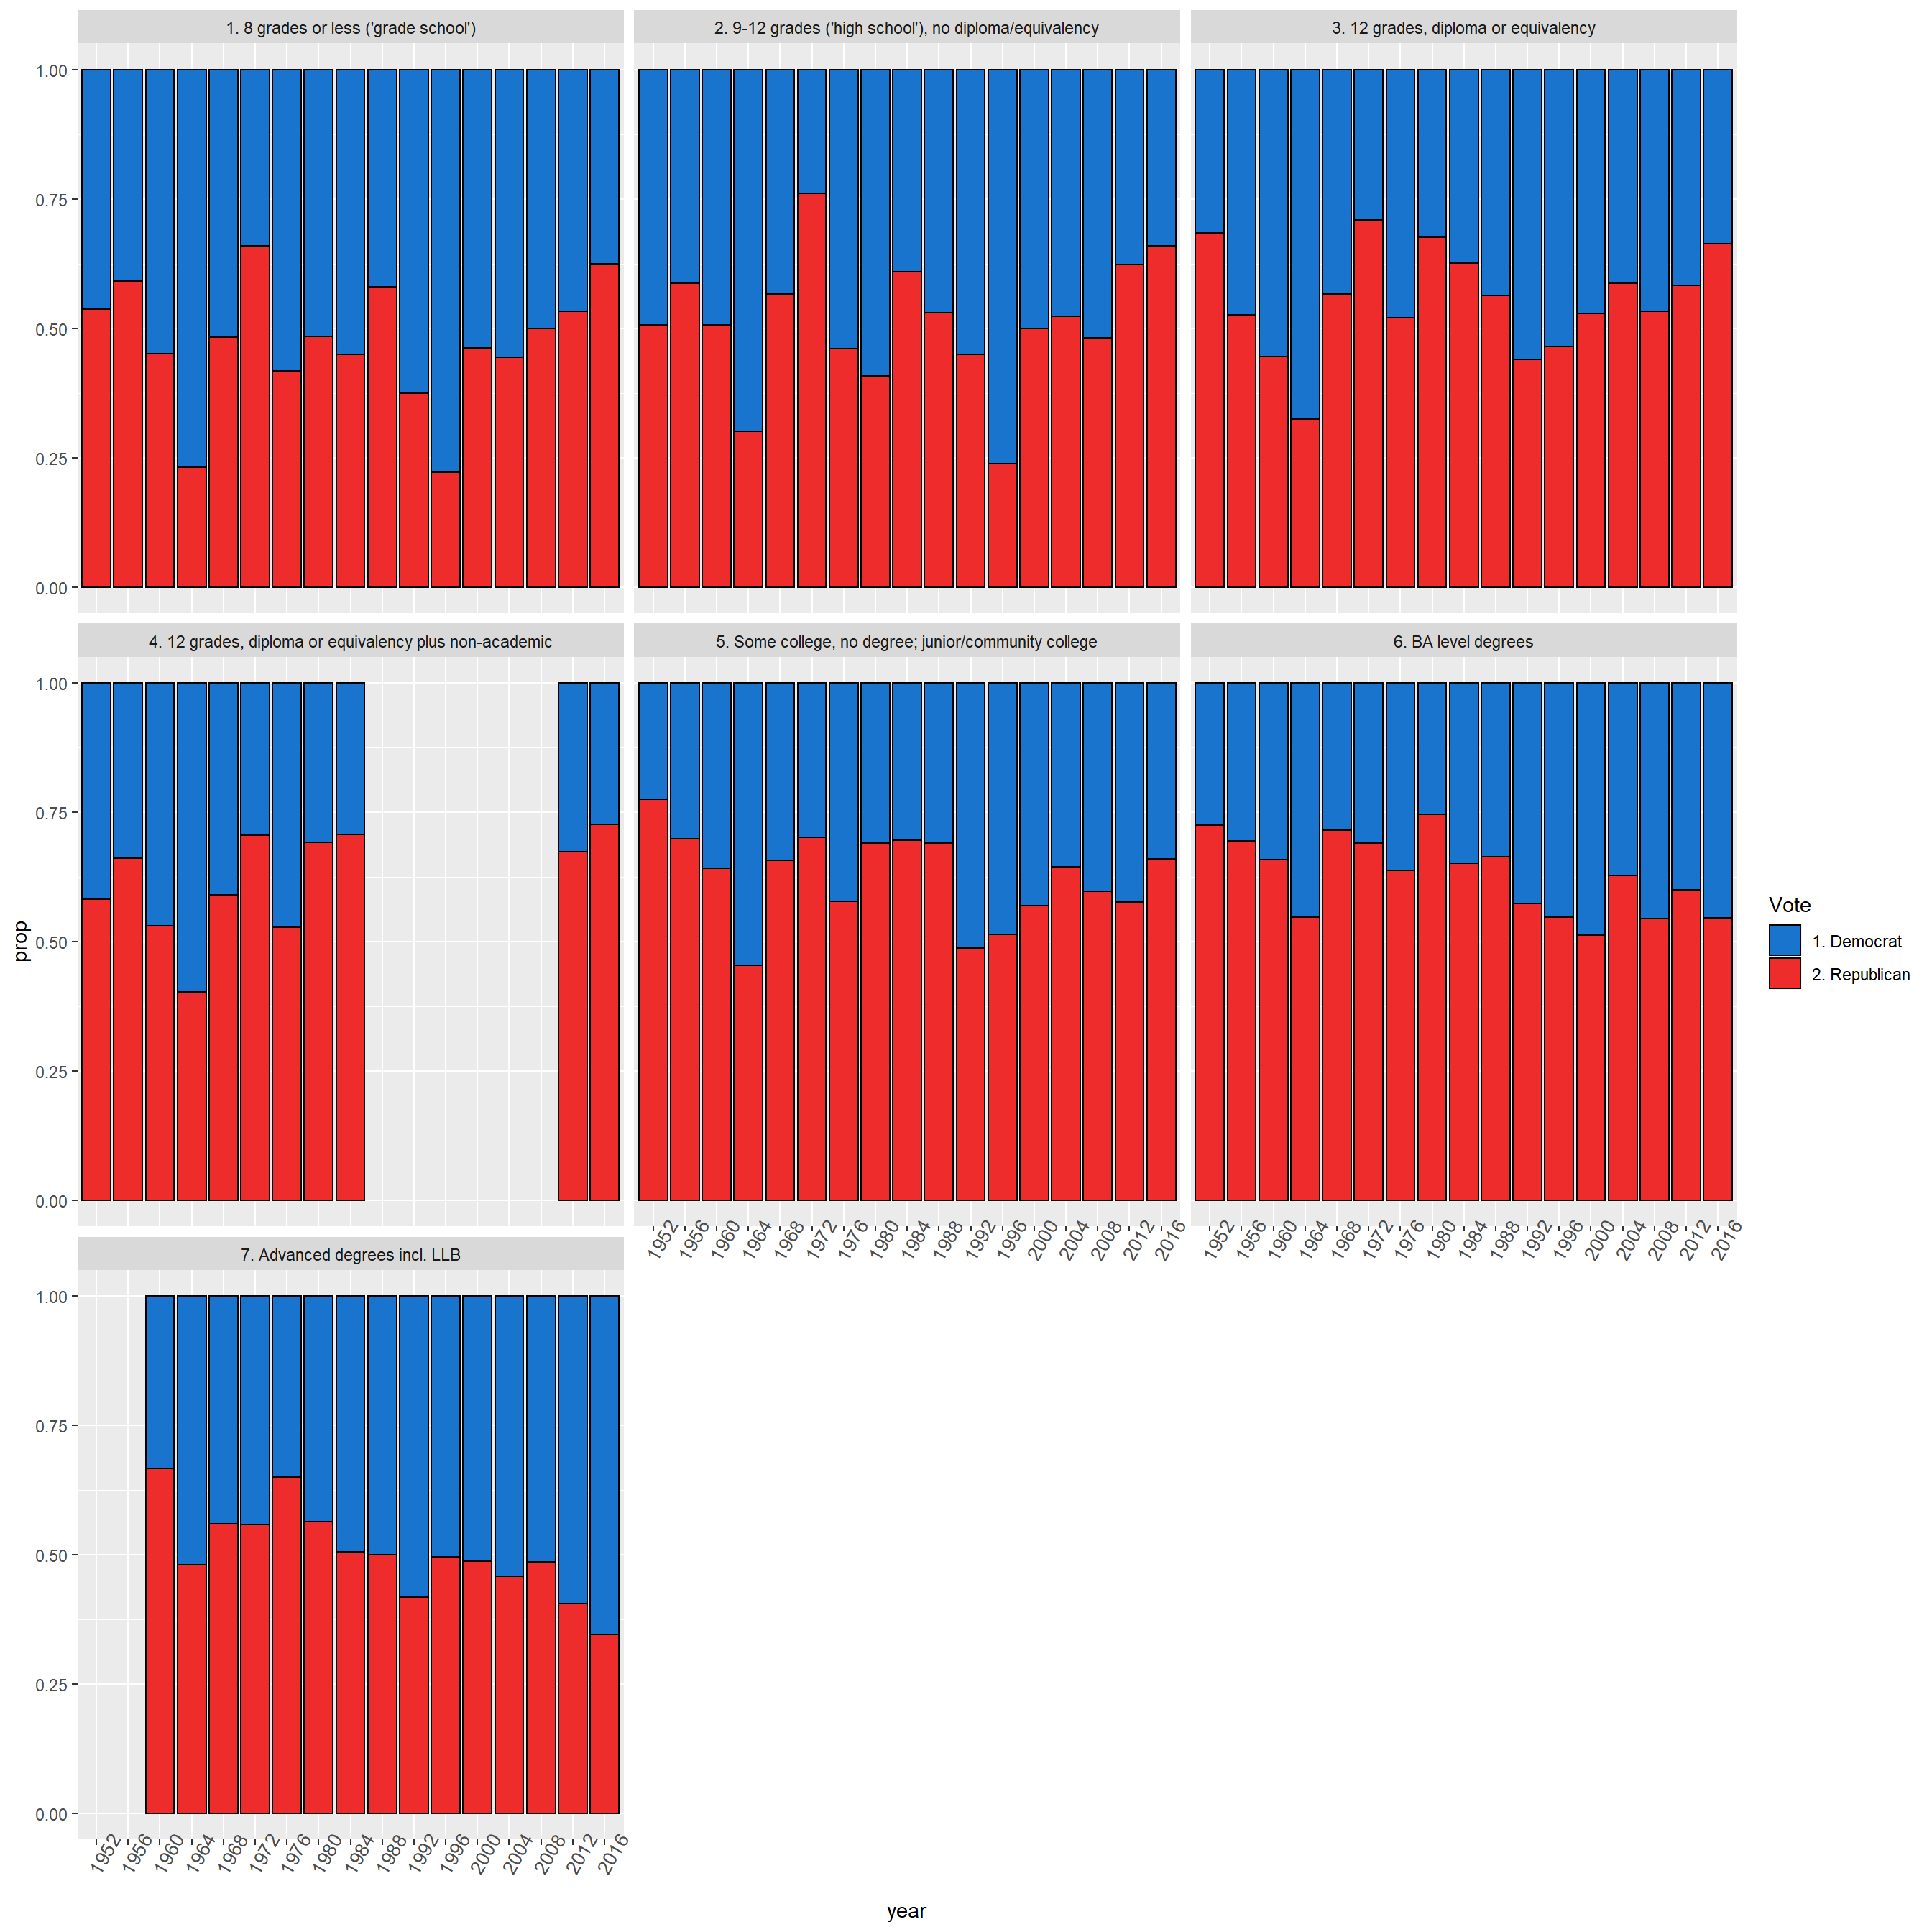
From the bar graph, we can conclude that there’s a reverse trending happening from the year of 2000. The 8 grades or less group tend to vote more for the Republicans whereas the advanced degree group tends to vote more for the Democrats. Historically speaking, we can definitely see more relatively low educated people willing to vote for Democrats and those who have a diploma of a college degree would rather vote Republican. So as far as the survey’s data represents, we can conclude that the first question we mentioned before is definitely a Yes, there indeed has a change.
Now, let’s focus more on the second question, which is what may cause such a trend.
Would Region be the Explanation?
As we all know, geographic influences are huge for politics in America. Each state has their own preferences when considering which political side they’ll be. Maybe a citizen who grows up in a more advanced city or more educational resources would change how they vote? Let us examine the below graphs to see the answer.
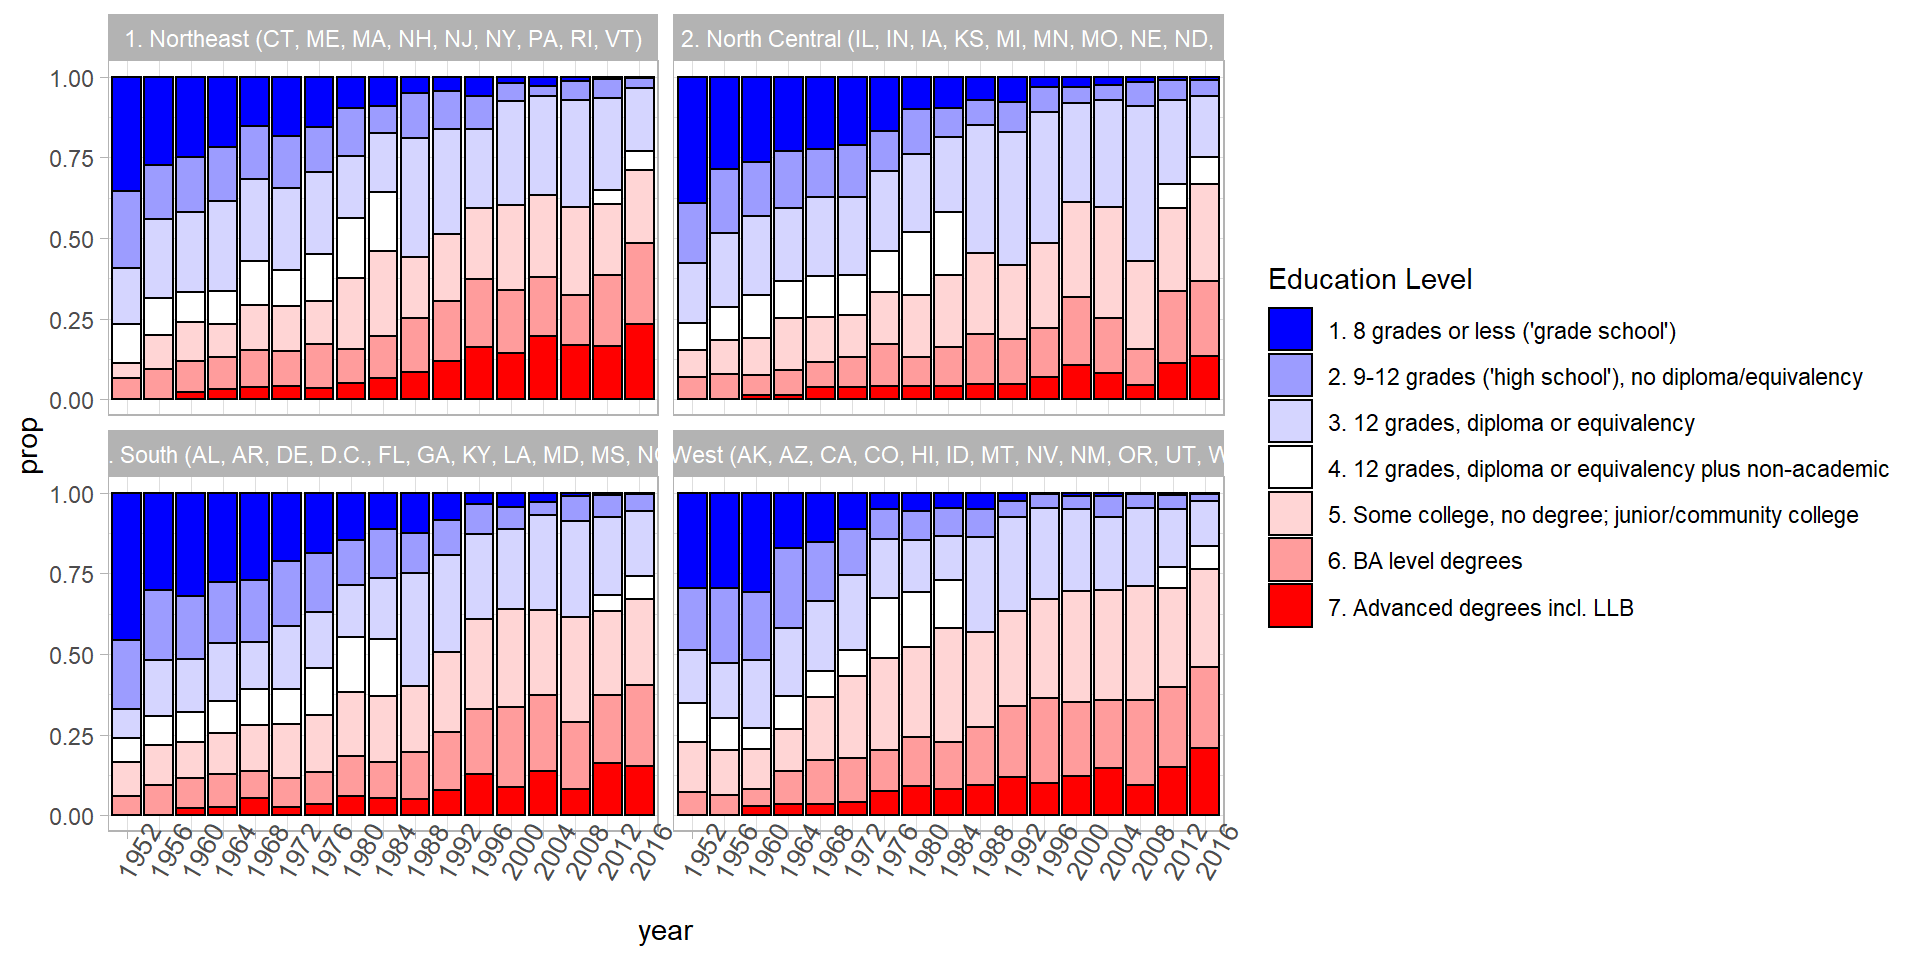
From this graph, although each relative region has a growth of education level, the obvious huge growth is from Northeast and Southeast, which makes a lot of sense as the famous ivy league school is mostly located in the Northeast and the Universities in California are also with high reputations. The much better resources seem to lead to more growth in the number of highly educated people.
But does the geological differences really cause the shift of voting behaviors? Let’s take a more deep down look inside.
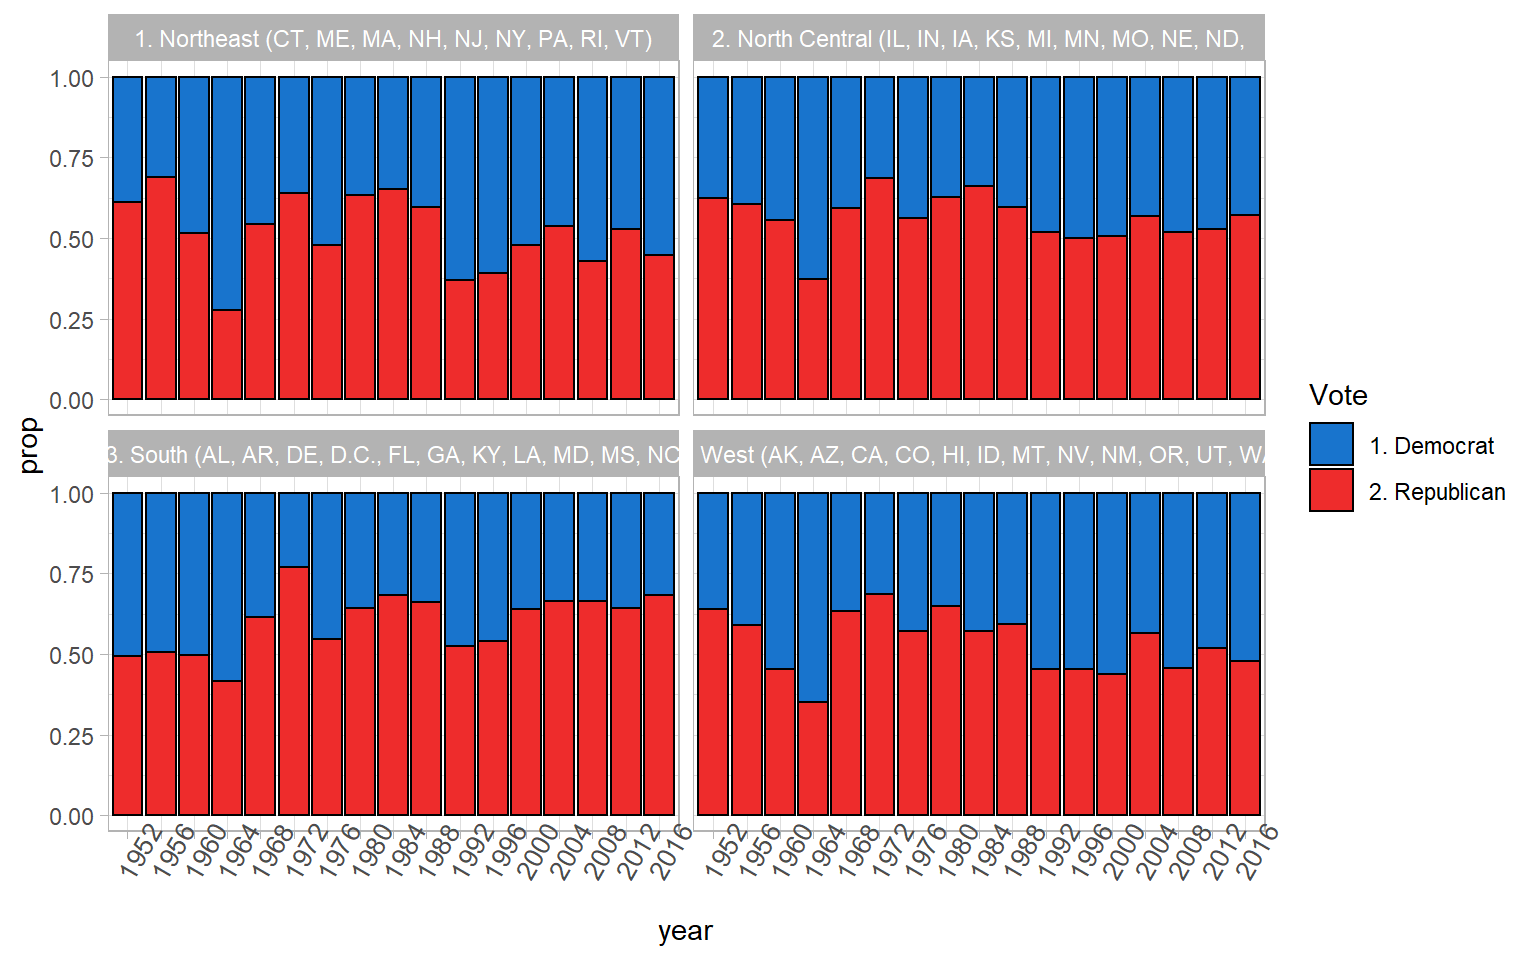
From the above graphs, there are clearly not too many differences over time compared to the figure where we answer the first question. We can see the relative voting preferences are all around 0.5 and even though Northeast and Southeast have a greater chance of education, there can’t conclude anything about their behavior is caused by that specifically. Therefore, the region may not be such a crucial factor in the influences.
Could it be more people not willing to vote?
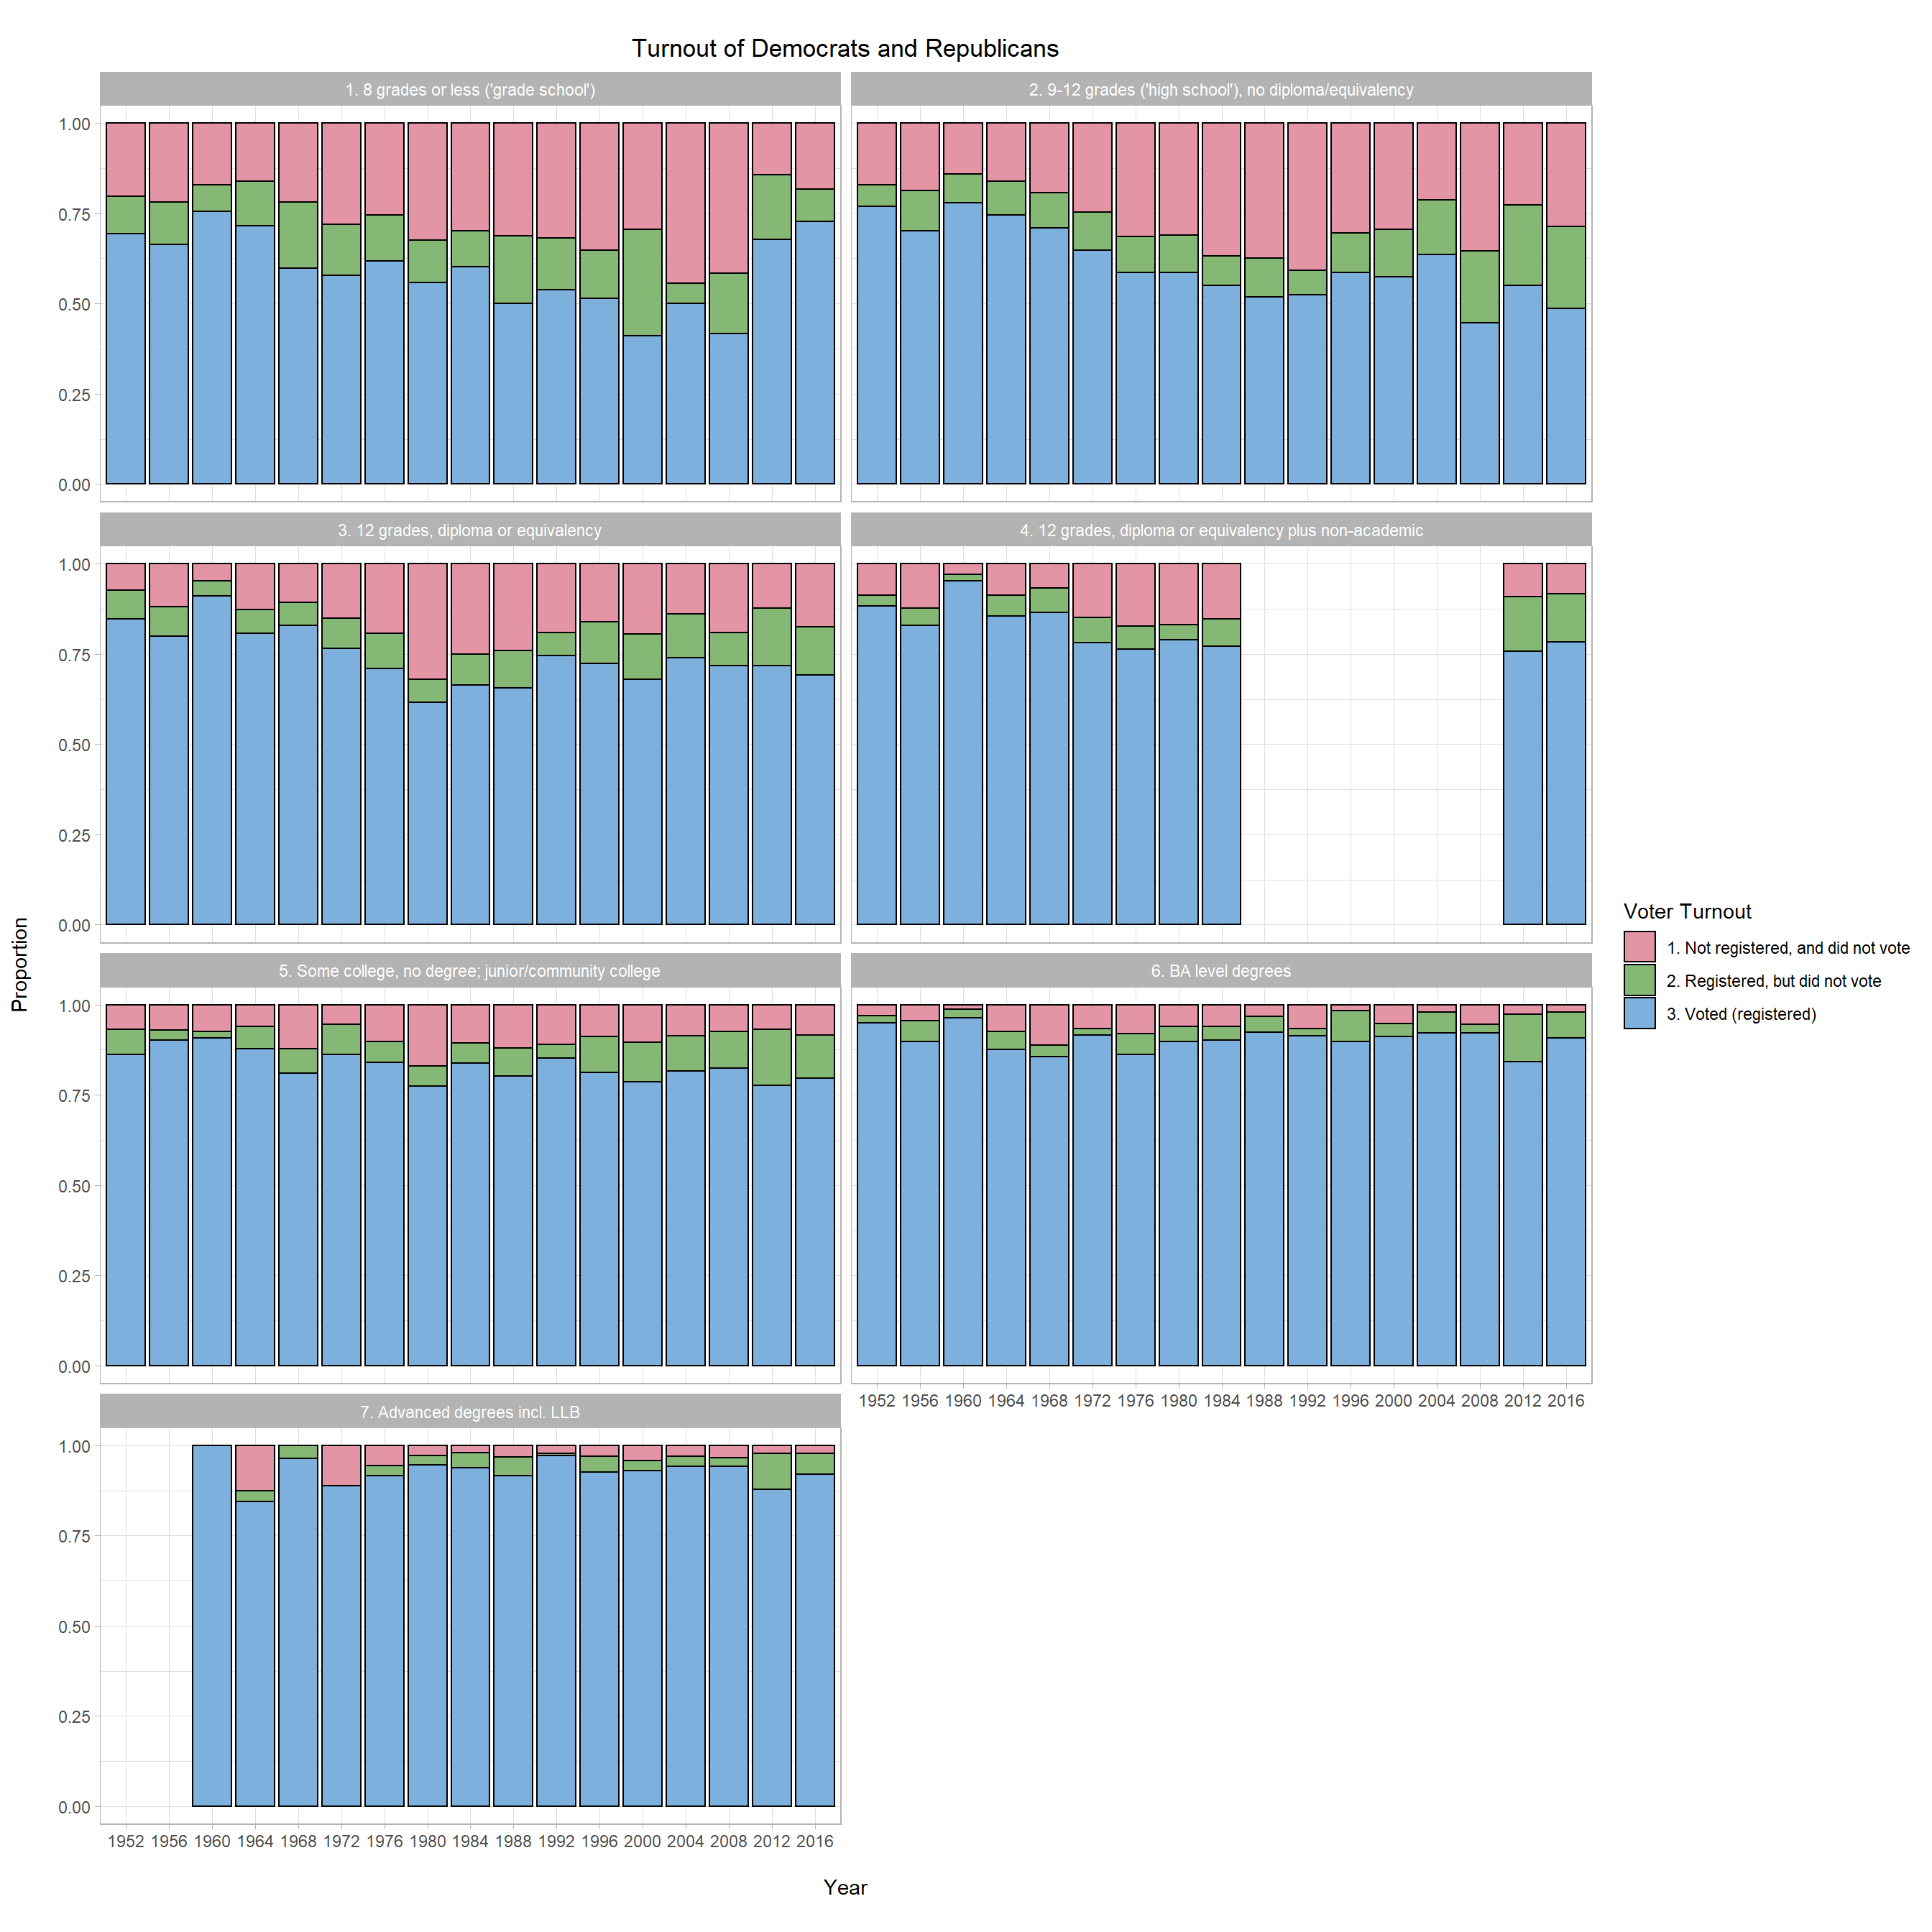
When we talk about the election, there’s at least some degree of people who will not vote. Although the above graphics can’t tell the reason for the turnout rate has changed over time, we now understand that each group of educated people may have a different voting behavior. The lower the degree, the higher chance of not voting.
What about how much spending the government willing to pay?
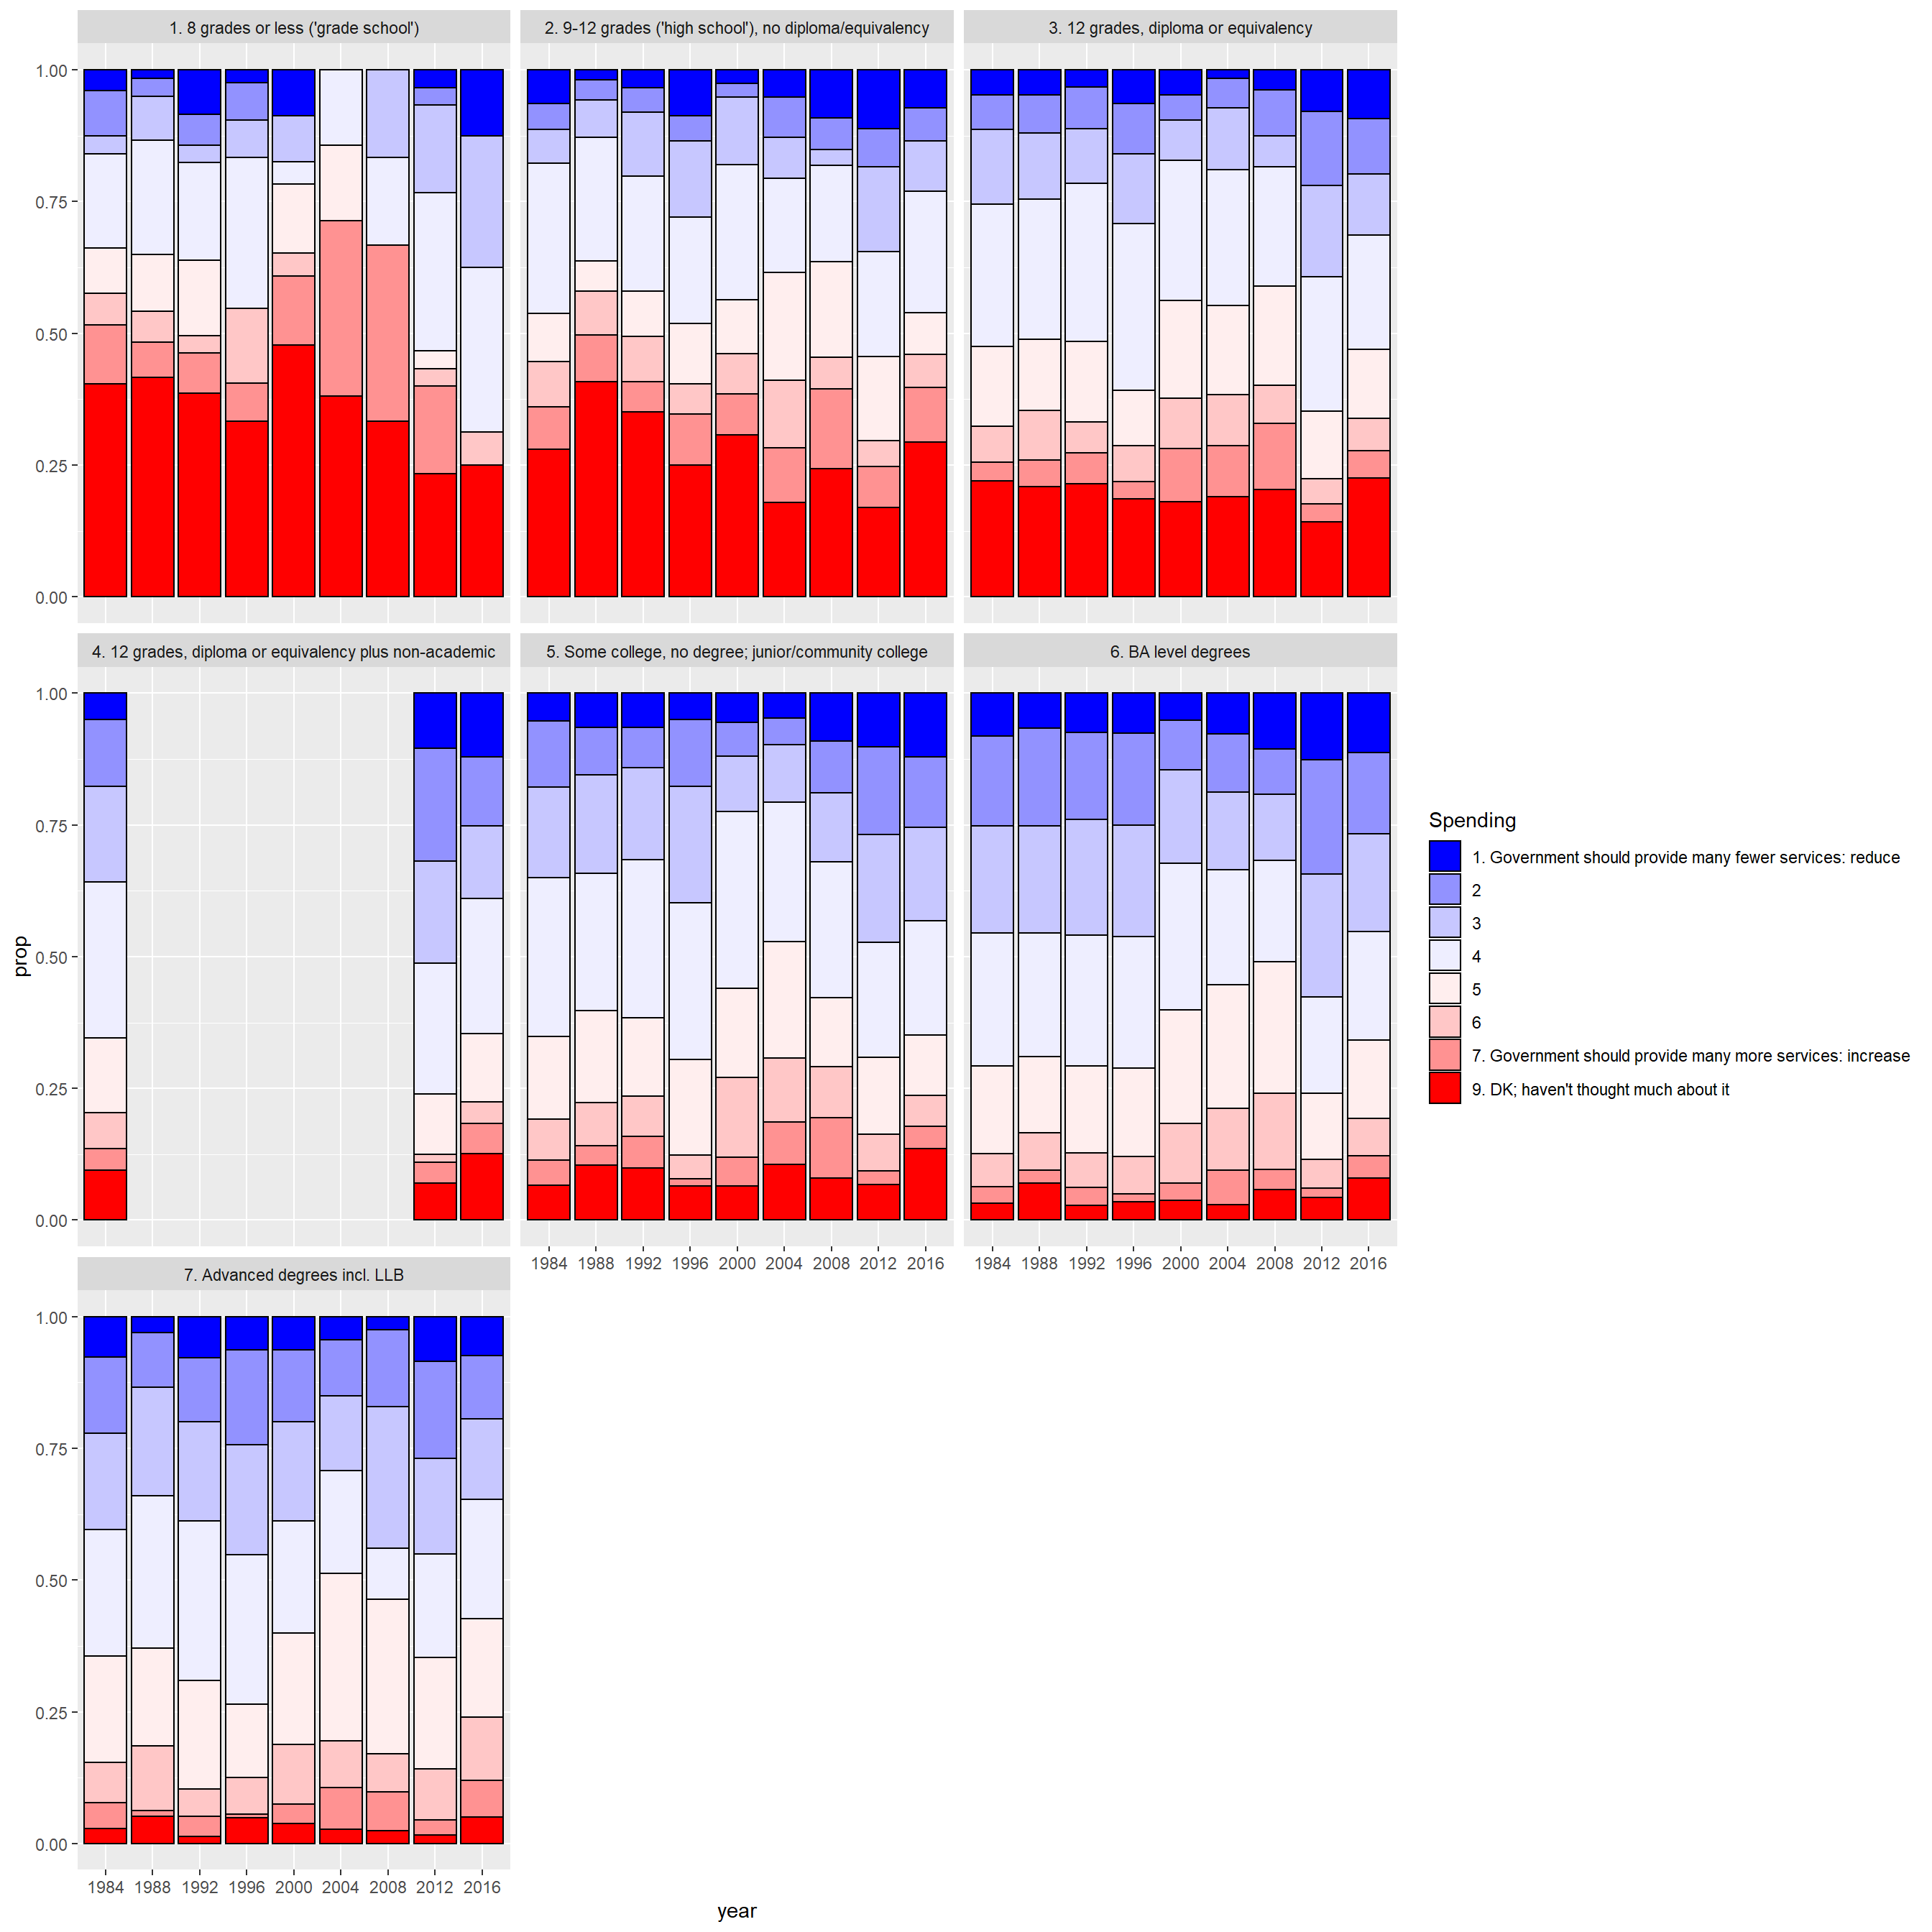
This might explain the reason that causes the differences in voting behaviors happening nowadays. The higher level of education, the more likely they want to get more support like welfare from the government. But it won’t explain the low level’s attitudes’ shift as they don’t much even care about how much money the government spends. Since the Democrats party now provides much more attention to the tuition and support of universities, these relatively higher educated people would rather support Democrats instead of Republicans.
Do different educated level people really care who would win?
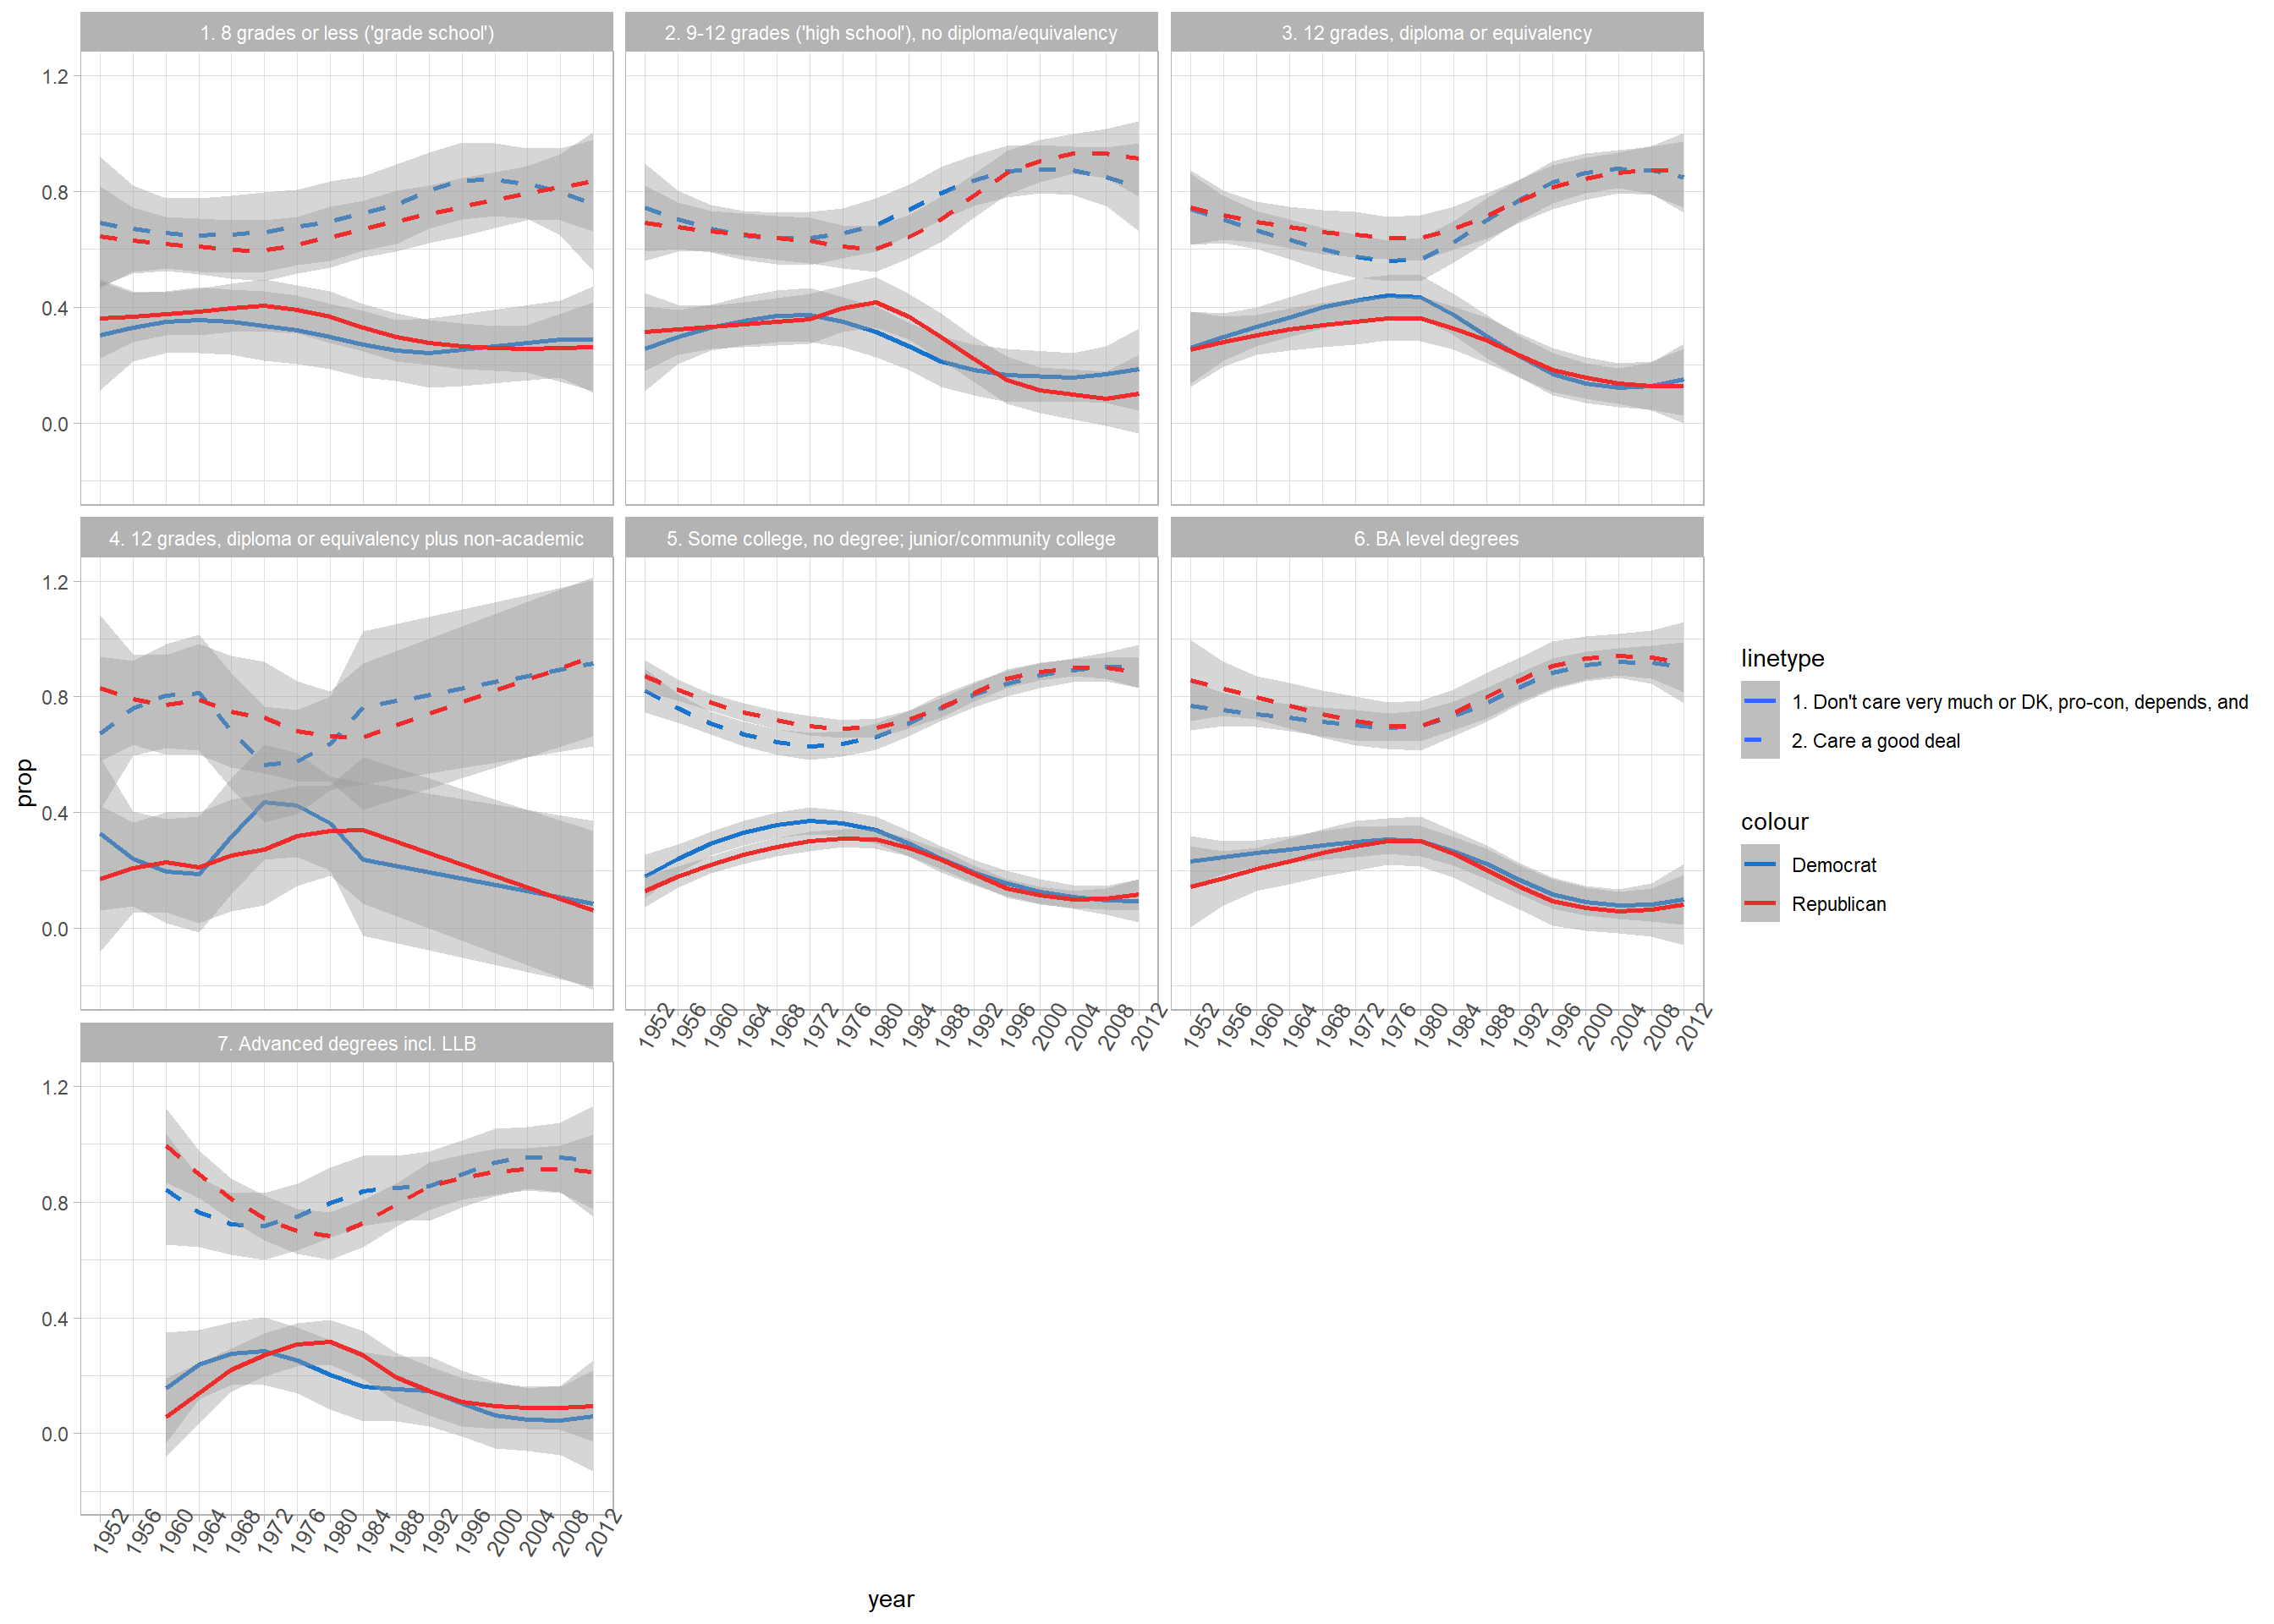
Now for the final variable that we’re going to illustrate, we check whether or not the voting is pointless after all. Because that proportion of change may happen simply cause they don’t even care which parties win, especially for the low educated ones. All the graphs above have a similar shape which tells that people indeed start to care more about the election of who’s gonna win, which kinds of explaining why for the group of 8 grades or lower people may start to thinking differently compared to a half-century before. But the rate of don’t care is still very high compared to the advanced degree group.
Conclusion
In conclusion, for the first question we’ve listed, the answer is a convincingly yes because of the proportion shifting as time goes on. But for the second question, due to the limitation of time and length of the blog, we simply can’t list all the factors (like income, etc.) to discuss and draw the graph with it, even though it is highly possible to be one of the reason. However, we managed to draw a few conclusions like the geological difference may not be the reason, and the concerns about who would win and how much of the government willing to pay for supporting education may be the answer to the second question.
Reflection
Like I’ve mentioned above, the more variables we use for analysis the more accurate our result will be to explain these differences in voting behavior. Note that attributes like age, gender, the occupation did not seem to have any impact on our result so I choose to ignore for a second. But without even try to check the hypothesis is dangerous. I understand that there is far more space to discover such as the more quantitative analysis beyond simply drawing graphs, but for now, we’re just settling down on the Exploratory part and if we have time we’ll do more like a prediction or inference on this dataset. This would be such an interesting topic with the upcoming 2020’s election.
Please check this repo to see more details github repository

Comments